
Graphic display

Graphic display |
The graphic display provides a two dimensional high speed plot control
window with zooming and autorange capability. The object can plot one
or two dimensional numerical data or directly evaluate given
functions. An arbitrary number of curves can be displayed
simultaneously.
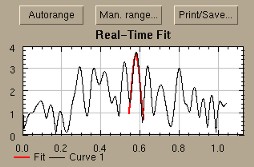
Fig. 1: Graphic display control
Common properties
Most properies in the property dialog affect all curves:
The "Min x", "Min y", "Max x", and "Max y" properties specify an
initial scaling range. Using properties "Autorange x" and "Autorange
y" automatic scaling can be switched on for the particular axis. With
"X-title" and "Y-title" properties axis labels can be specified. The
font used for labelling can be choosen during edit time pressing the
button in the font property. In the "Curve count" properties specify
the number of simultaneously displayed curves. To specify properties
of the individual curves, press the button in the "Curves" property.
Curve properties
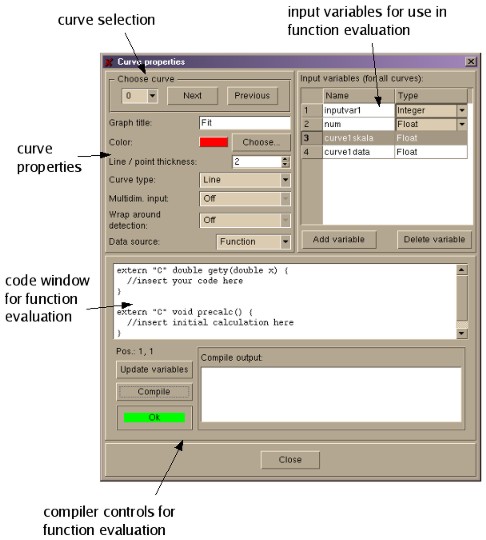
Fig. 2: Curve properties
In the curve property dialog use the "choose curve" controls to switch
to the curve you want to change properties. Each curve has the
following options:
- Graph title:This sets the label which appears in the legend
below the plot.
- Color:The color that is used for painting lines or points.
- Curve type:When set to "Line" all data points are
connected, otherwise they are drawn as single points.
- Multidim. input:Only available when data source is a
vector. When switched on the source vector must be created with a
vector memory. This is useful for drawing several curves at once.
- Wrap around detection:If set to yes, the object tries do
detect when the scale vector restarts from the beginning and in this
case prevents connecting data points. This is useful when one data
vector contains multiple curves stacked behind each other and only
when "curve type" is set to "Line".
- Data source:When set to "Vector", two input variables are
created for scale and data vector. Data to be plotted is taken out of
these input variables. If the scale input vector has no data, the data
vector is plotted over the element index. If this property is set to
"Function", the code window is enable. One must provide a function
"double gety(double x)" which is called for every plotted data point
x. The function must give out the appropriate y value. An additional
function precalc is provided which is called before "gety" is called
the first time. This can be used for doing calculations which effect
all data points, for example calculating a mean value etc.. Both
functions are compiled to a single shared object file which is
included during execution (see Calculator
object). For passing data between both functions normal global C variables can be used.
Plot functions during run time
During run time there are 3 buttons above the plot which allow
changing autorange functionality, providing a manual range and print
the current plot. The print function generates postscript which can
alternatively be saved to disk.
Using the left mouse button parts of the plot can be zoomed. When a
zoom is performed autorange is switched off. Unzoom is done by
pressing the right mouse button somewhere in the plot.
The Vimms User Manual